Midstream energy firms deliver 36%+ returns in 2019, without the commodity price risk
Midstream businesses sit between the production of energy resources and their ultimate distribution to end markets. Essentially, they connect energy supply with energy demand by providing several key intermediary services, including gathering, processing, refining, marketing, storage and transportation.
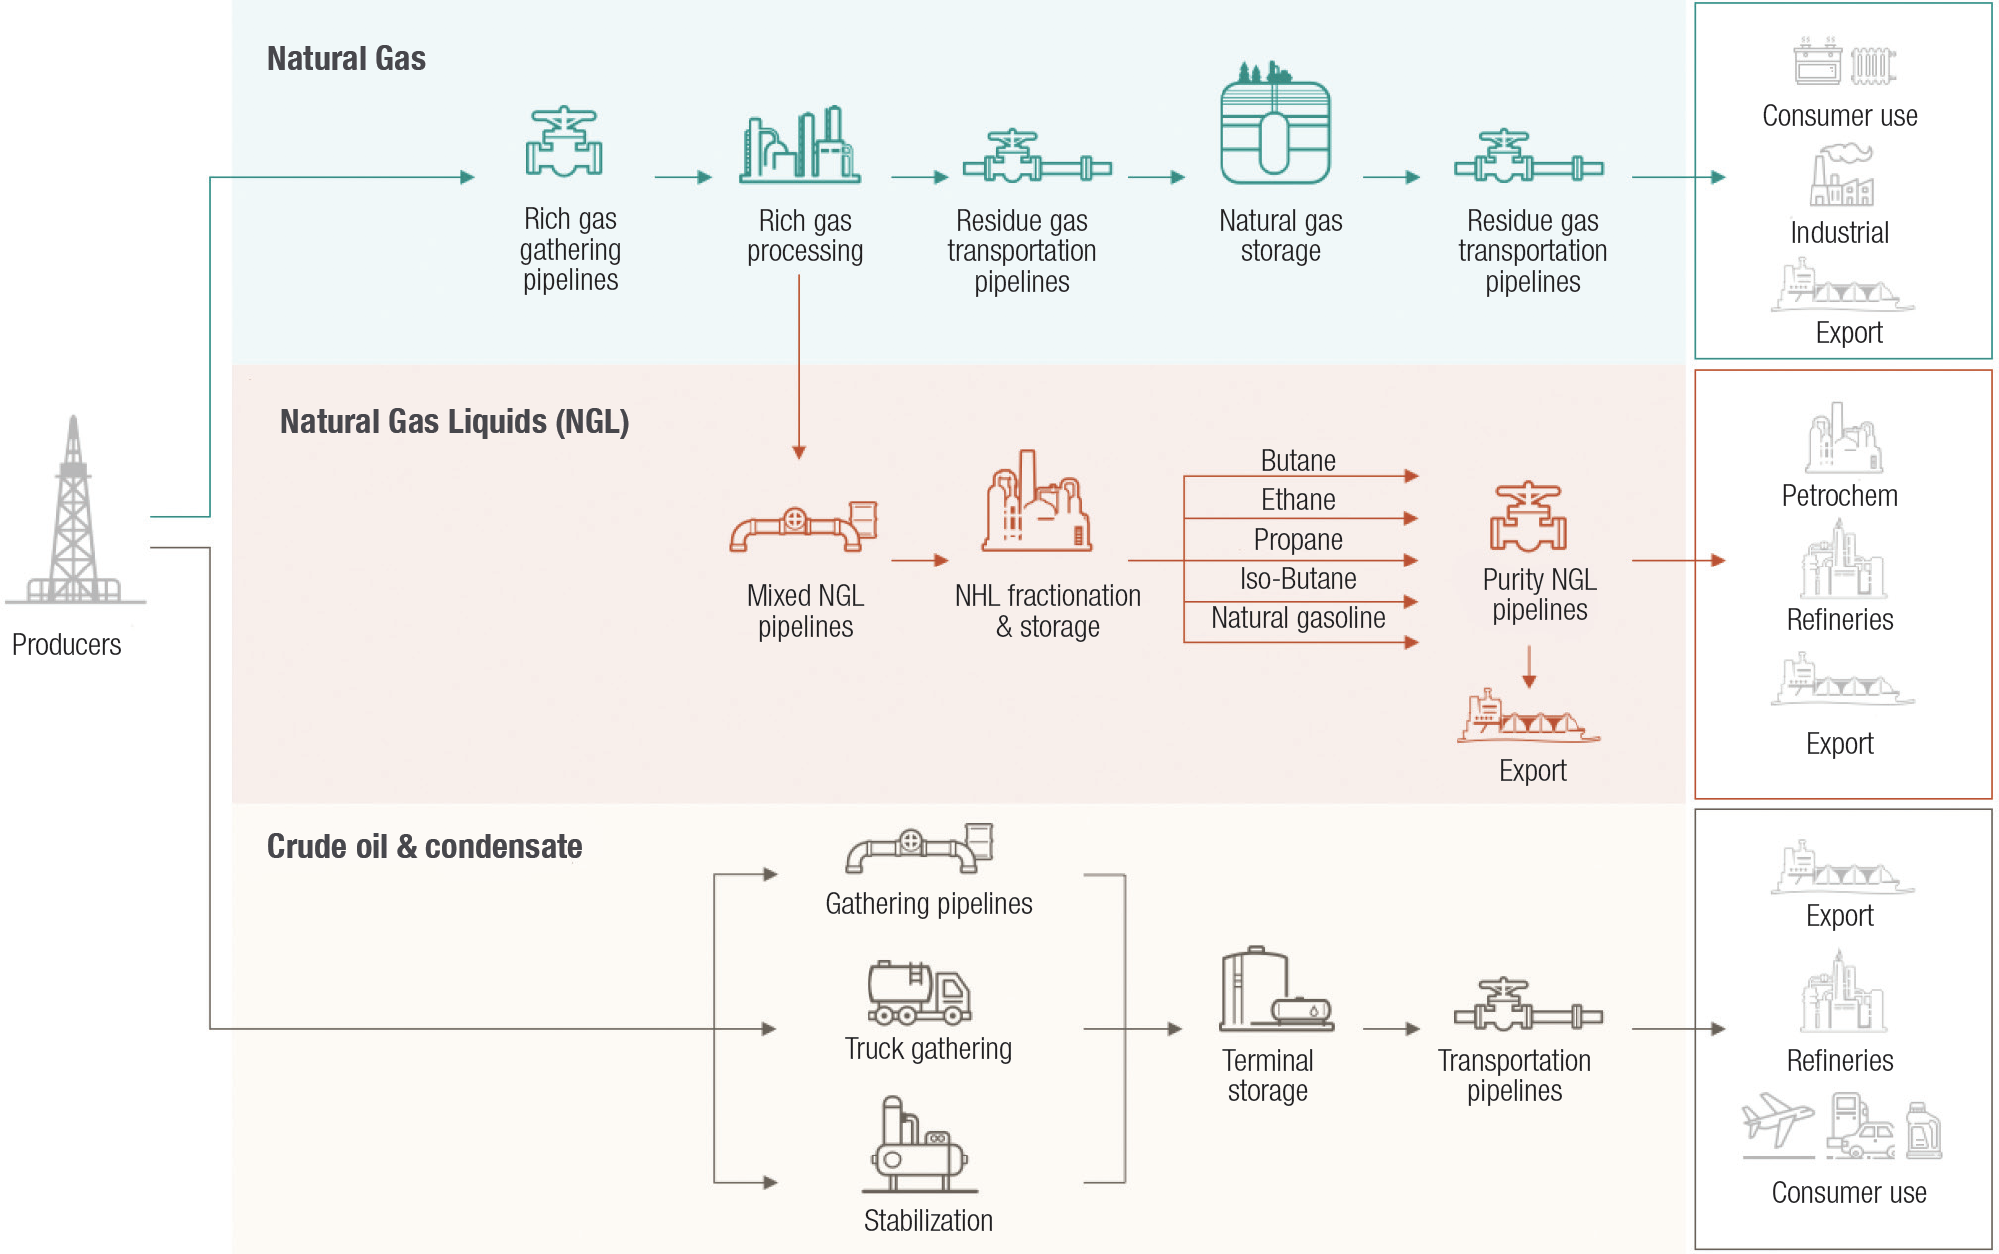
Source: EnLink Midstream Website, Credit Suisse Equity Research, Oil & Gas Primer US Midstream, April 18, 2019
The various value chain activities that midstream firms can perform lead to varying revenue streams and structures.
The effect of these revenue models is to reduce the midstream company’s exposure to commodity prices and make them more sensitive to volumes.
Crude Oil (“CO”) and Natural Gas (“NG”) resources must be refined and/or processed in order to maximize the returns from each end market. CO and NG are long chains of hydrocarbons that must be treated to remove impurities (water, sulfur compounds, nitrogen, trace metals, etc.) before being refined and/ or processed. Refining CO involves cracking the hydrocarbon while processing NG involves fracturing the hydrocarbon.
CO can be cracked into petrol, gasoline, kerosene, diesel, etc., all of which have specific industrial uses and end market prices. The combined differential between the unrefined CO cost and the aggregate refined product revenue is called the “crack spread” and measures the profitability of the refined CO.
NG can be fractured into ethane, propane, butane, etc., all of which have specific industrial uses and end market prices. The combined differential between the unprocessed NG cost and the aggregate processed product revenue is called the “frac spread” and measures the profitability of the processed NG.
- “Take-or-pay” contracts apply most often to pipeline and storage assets. Under take-or-pay contracts the client pays for guaranteed capacity or volumes for a fixed period of time. The client is obligated to pay for a minimum amount of capacity or volumes regardless of whether they utilize them or not.
- Regulated returns apply to monopoly assets such as long- haul transportation pipelines. In this case a federal regulator determines a maximum allowable return on specified regulatory capital based on a set capital structure over a pre-determined time period. The regulator then monitors compliance and adjusts the return level and components at set periodic hearings.
- “Fee-for-service” revenue models generally apply to the transport, storage, processing and/or marketing of energy resources. A tariff or toll is applied to volumes realized over a time period and the client makes periodic payments based on this formula.
The effect of these revenue models is to reduce the midstream company’s exposure to commodity prices and make them more sensitive to volumes.
Crude Oil (“CO”) and Natural Gas (“NG”) resources must be refined and/or processed in order to maximize the returns from each end market. CO and NG are long chains of hydrocarbons that must be treated to remove impurities (water, sulfur compounds, nitrogen, trace metals, etc.) before being refined and/ or processed. Refining CO involves cracking the hydrocarbon while processing NG involves fracturing the hydrocarbon.
CO can be cracked into petrol, gasoline, kerosene, diesel, etc., all of which have specific industrial uses and end market prices. The combined differential between the unrefined CO cost and the aggregate refined product revenue is called the “crack spread” and measures the profitability of the refined CO.
NG can be fractured into ethane, propane, butane, etc., all of which have specific industrial uses and end market prices. The combined differential between the unprocessed NG cost and the aggregate processed product revenue is called the “frac spread” and measures the profitability of the processed NG.
| Crude Oil and Natural Gas Refined and Processed Products | |||
|---|---|---|---|
| Crude Oil | Natural Gas | ||
| Refined Product | Applications | Natural Gas Liquid | Applications |
| Refinery Gas | Used as fuel | Methane | Heating, power generation |
| Petrol | Cars | Ethane | Plastics, chemical production |
| Naphtha | Chemical production | Propane | Heating, cooking, chemical production |
| Gasoline | Cars | Butane | Chemical production, blending |
| Kerosene | Jet fuel | Isobutane | Refinery feedstock, chemical production |
| Diesel Oil | Trucks | Pentane | Natural gas, polystyrene foam |
| Fuel Oil | Power generation | Pentanes Plus | Blending for vehicle fuel and bitumen production |
| Residue | Roads, construction | ||
Source: Petro Canada and Kinder Morgan Inc.
Energy demand is quite consistent and generally grows in line with real GDP growth. In recent years, energy efficiency and conservation efforts have eaten into the energy demand growth rate. In contrast energy supply is very volatile driven by seasonality, commodity prices and exploration success. Thus, for midstream companies, supply growth tends to be much more important for long-term growth. U.S. production growth should outpace Canadian production growth leading to greater opportunities for higher growth for U.S. midstream companies or Canadian companies with U.S. assets.
Oil & Condensate Production

Dry Natural Gas Production

NGL Production

Source: Enterprise Products Presentation, Credit Suisse Equity Research, Oil & Gas Primer US Midstream, April 18, 2019
*Assumes all Ethane is recovered
*Assumes all Ethane is recovered
Canadian Oil Sands & Conventional Production

Source: Canadian Association of Petroleum Producers (CAPP)
Canadian Natural Gas Production, Demand and Exports, 2005-25

Source: U.S. Energy Information Administration, based on Canada’s National Energy Board, Canada’s Energy Future 2016: Energy Supply and Demand Projections to 2040
Midstream companies can generate internal growth if they are located near resources with rising volumes requiring heavy processing and/or refining. The best midstream companies create value chains of related services that allow them to attract many, quality clients that they can sell an integrated suite of services to. This business model often facilitates accretive acquisition-driven growth that expands the value chain and services offered. Historically, midstream companies that have the ability to fund consistent growth capital expenditures out of internal cash flow have also generated strong returns.
In 2019, the energy positions of the Starlight Global Infrastructure fund delivered a 36.2% total return.
Keyera Corporation (“Keyera”) is a Canadian midstream company that services oil and gas producers in the Western Canada Sedimentary Basin. Keyera’s interconnected gas plants, gathering systems and pipelines, processing and fractionation facilities, rail and truck terminals, above ground and underground storage assets and its Alberta EnviroFuels business provide the firm with a compelling, integrated service offering with enduring competitive advantages.
Most of Keyera’s gas plants are able to process both sweet and sour gas and are equipped to extract valuable NGLs. Their interconnected NGL facilities in the Edmonton- Fort Saskatchewan area allow them to fractionate, store, transport and deliver NGL products into most of the pipelines, petrochemical plants, refineries and storage facilities in Alberta. This solid footprint gives Keyera a strong platform for its liquids marketing business, which sells propane, butane, iso-octane and condensate to more than 100 retail and industrial customers in niche markets across North America. Finally, Keyera’s industry- leading condensate system provides condensate handling services to many major exploration and production and multi- national oil and gas companies that are driving oil sands growth.
Keyera has guided towards capital spending of $850 million in 2019, $750 million in 2020 and $450 million in 2021 with targeted returns of 10 – 15%2. The firm has no intention of raising equity beyond its dividend reinvestment program and is operating at 2.5x debt/EBITDA, the bottom end of its guidance range2. Since Keyera’s IPO in 2003, the distribution has compounded at 8.0% per year, and Keyera currently yields 5.6% at a 50 – 70% payout ratio of adjusted cash flow from operations. In 2019 Keyera generated a 39.5% total return3 for the Starlight Global Infrastructure Fund and we continue to hold a material weight in the fund.
1 Source: Bloomberg LP. & Starlight Capital. From December 31, 2018 to December 31, 2019.
2 Source: Keyera Corporate Profile, January 2020. Debt/EBITDA uses Keyera methodology assumes Net Senior Debt includes 50% of subordinated debt. Compound annual growth rate from 7/15/2003 to 9/30/2019.
3 Source: Bloomberg LP. & Starlight Capital. From December 31, 2018 to December 31, 2019.
Certain statements in this document are forward-looking. Forward-looking statements (“FLS”) are statements that are predictive in nature, depend upon or refer to future events or conditions, or that include words such as “may,” “will,” “should,” “could,” “expect,” “anticipate,” “intend,” “plan,” “believe,” or “estimate,” or other similar expressions. Statements that look forward in time or include anything other than historical information are subject to risks and uncertainties, and actual results, actions or events could differ materially from those set forth in the FLS. FLS are not guarantees of future performance and are by their nature based on numerous assumptions. Although the FLS contained herein are based upon what Starlight Capital and the portfolio manager believe to be reasonable assumptions, neither Starlight Capital nor the portfolio manager can assure that actual results will be consistent with these FLS. The reader is cautioned to consider the FLS carefully and not to place undue reliance on FLS. Unless required by applicable law, it is not undertaken, and specifically disclaimed that there is any intention or obligation to update or revise FLS, whether as a result of new information, future events or otherwise.
Commissions, trailing commissions, management fees and expenses all may be associated with investment funds. Please read the prospectus before investing. Investment funds are not guaranteed, their values change frequently, and past performance may not be repeated.
Starlight, Starlight Investments, Starlight Capital and all other related Starlight logos are trademarks of Starlight Group Property Holdings Inc.